

Managed File Transfer platforms generate enormous amounts of operational data.
They record transfers, workflows, processing times, failures, retries, acknowledgments, partner activity, security events, administrative changes, and infrastructure conditions.
The challenge is not producing more data. Most enterprises have already solved that problem several times.
The challenge is converting technical activity into information management can use to evaluate performance, understand risk, plan capacity, hold service owners accountable, and make better decisions.
An executive should not need to interpret protocol response codes to determine whether a critical business service is operating properly. A business owner should not need three administrators and a spreadsheet to understand whether expected workflows completed. And a monthly report should not be the first indication that yesterday’s payment file never arrived.
Effective MFT executive reporting connects technical evidence to business outcomes.
AI-assisted dashboards can make that reporting even more useful by summarizing important changes, identifying unusual behavior, correlating related events, and helping authorized users ask questions in natural language.
However, AI does not replace accurate data, clearly defined metrics, strong governance, or experienced people. It makes those foundations easier to use.
In Summary
MFT executive reporting gives management teams a clear view of how critical data exchanges are performing across business units, applications, workflows, trading partners, and infrastructure.
A well-designed management dashboard should help answer:
- Are critical workflows completing successfully and on time?
- Which services, applications, or partners require attention?
- Are transaction volumes and processing demands increasing?
- Where are recurring exceptions or bottlenecks developing?
- Are important workflows approaching or missing service commitments?
- Are security and governance controls operating as expected?
- How quickly are problems detected and resolved?
- Is the environment prepared for future demand?
- What changed?
- What requires management action now?
AI-assisted capabilities can add another layer of context:
- What activity is unusual?
- Which changes may be related to a performance decline?
- Which workflows are moving outside their normal range?
- Where should an investigation begin?
- Which developing conditions present the greatest business risk?
The objective is not to place every available metric on one screen. It is to present the right information to the right audience with enough context to support a decision.
Key Takeaways
- Management reporting should emphasize business outcomes rather than protocol activity alone.
- Executive, business, operational, security, and audit users need different views of the same environment.
- Customizable dashboards should support filtering by business unit, tenant, application, workflow, partner, service priority, geography, and reporting period.
- Management should be able to track service performance, exceptions, capacity, security, partner behavior, trends, and business impact.
- Historical reporting is necessary for recognizing recurring problems and planning future capacity.
- Real-time dashboards and scheduled reports serve different purposes and should work together.
- AI-assisted dashboards can summarize conditions, identify anomalies, correlate events, and support natural-language investigation.
- AI-generated conclusions should distinguish observed facts from inferred causes and predicted outcomes.
- Reporting and AI access must remain governed by Zero Trust, least privilege, role-based access, tenant separation, and auditing.
- The best dashboard is not the one containing the most charts. It is the one that helps the right person make the right decision.
What Is MFT Executive Reporting?
MFT executive reporting converts transfer, workflow, partner, security, and system activity into business-relevant performance information.
Traditional transfer reports often answer technical questions:
- How many files were sent?
- How many transfers failed?
- Which protocol was used?
- How long did the transfer take?
- Which endpoint returned an error?
Those details remain essential for administrators. Executive reporting answers a different set of questions:
- Did critical business services perform as expected?
- What business processes were affected by exceptions?
- Which partners or applications are creating recurring risk?
- Are service levels improving or declining?
- Is operational demand growing faster than capacity?
- Which issues require management intervention?
- Are investments in automation and modernization producing measurable results?
For example, a 99.8% transfer-success rate may appear excellent.
It looks less impressive if the unsuccessful 0.2% contains payroll files, settlement instructions, healthcare claims, customer orders, or regulatory submissions.
The metric may be accurate. Without business context, it may also be misleading.
How Executive Reporting Relates to Monitoring and Observability
Reporting, dashboards, observability, and AI-assisted operational intelligence are related, but they are not interchangeable.
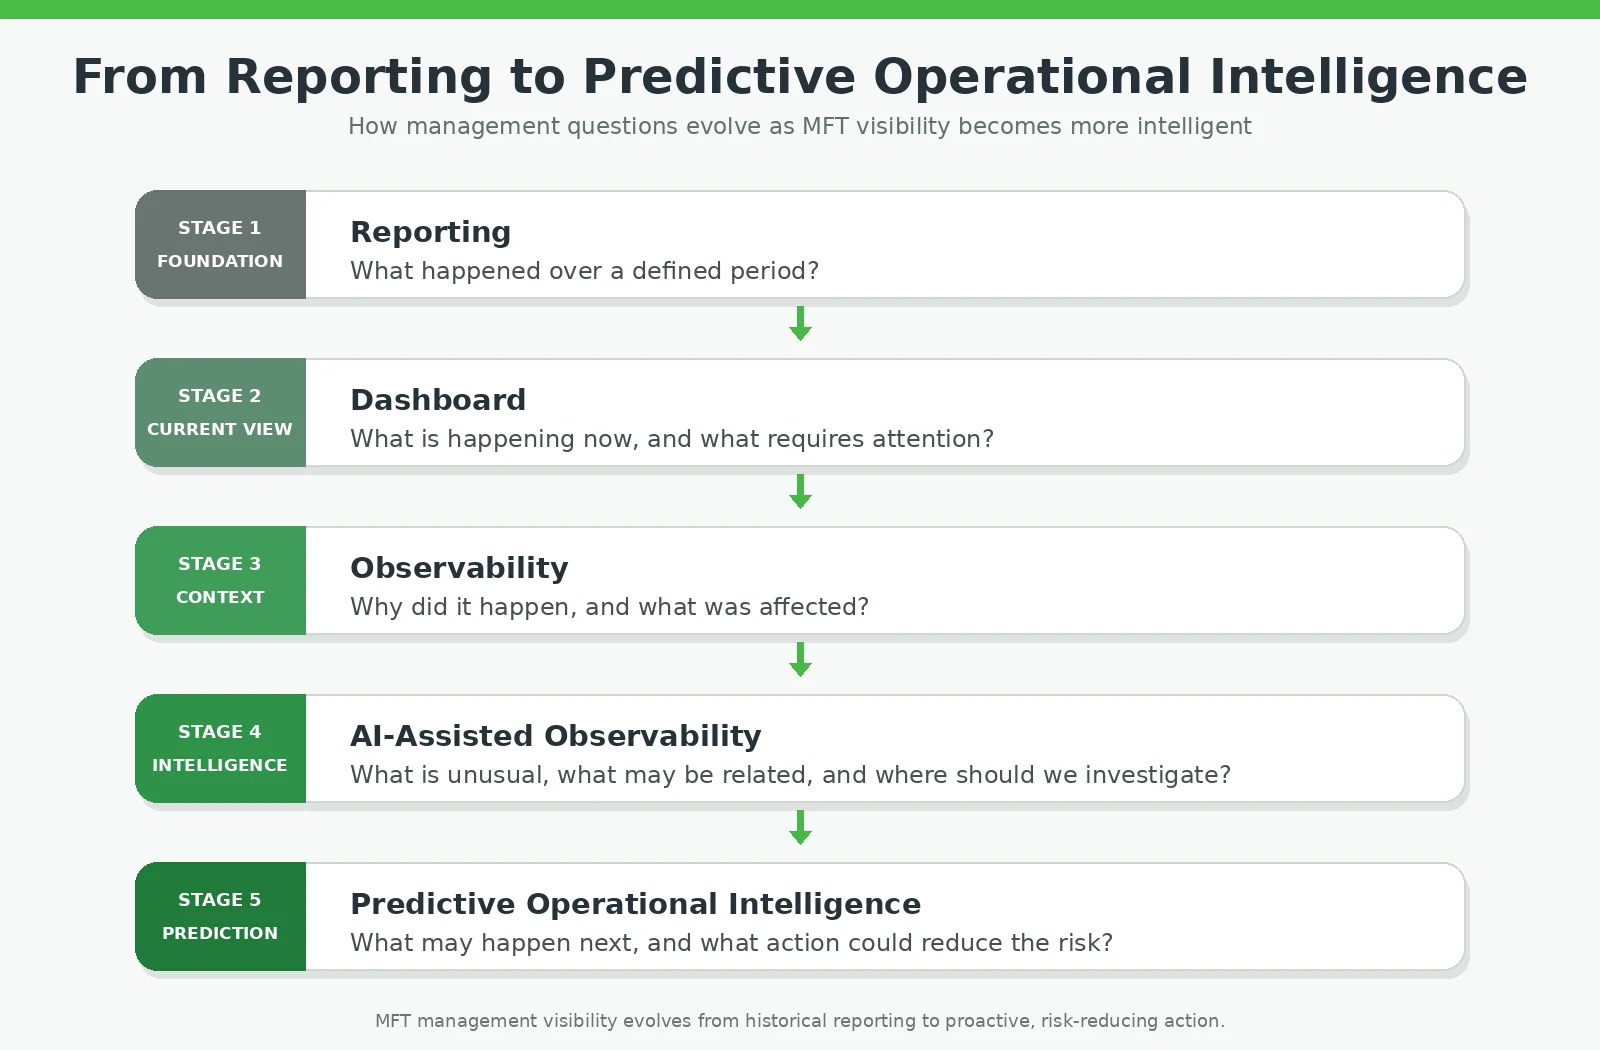
This article focuses on how operational information should be presented to management.
It does not repeat the underlying technical disciplines of transaction tracing, infrastructure telemetry, configuration-change tracking, or root-cause investigation. Those subjects are addressed in What Is MFT Observability? Complete Visibility for Enterprise File Transfer.
Similarly, detailed guidance on defining delivery windows, workflow-level targets, early-warning thresholds, breaches, and escalation is available in Managed File Transfer SLA: Best Practices for Reliable, Compliant, High-Performance MFT.
Executive reporting consumes information from these disciplines and presents it in a form management can act upon.
Executive Dashboards and Operational Dashboards Are Different
One dashboard should not attempt to satisfy every audience.
Executives, business owners, operations teams, security personnel, auditors, and administrators have different responsibilities. Their dashboards should reflect those responsibilities.
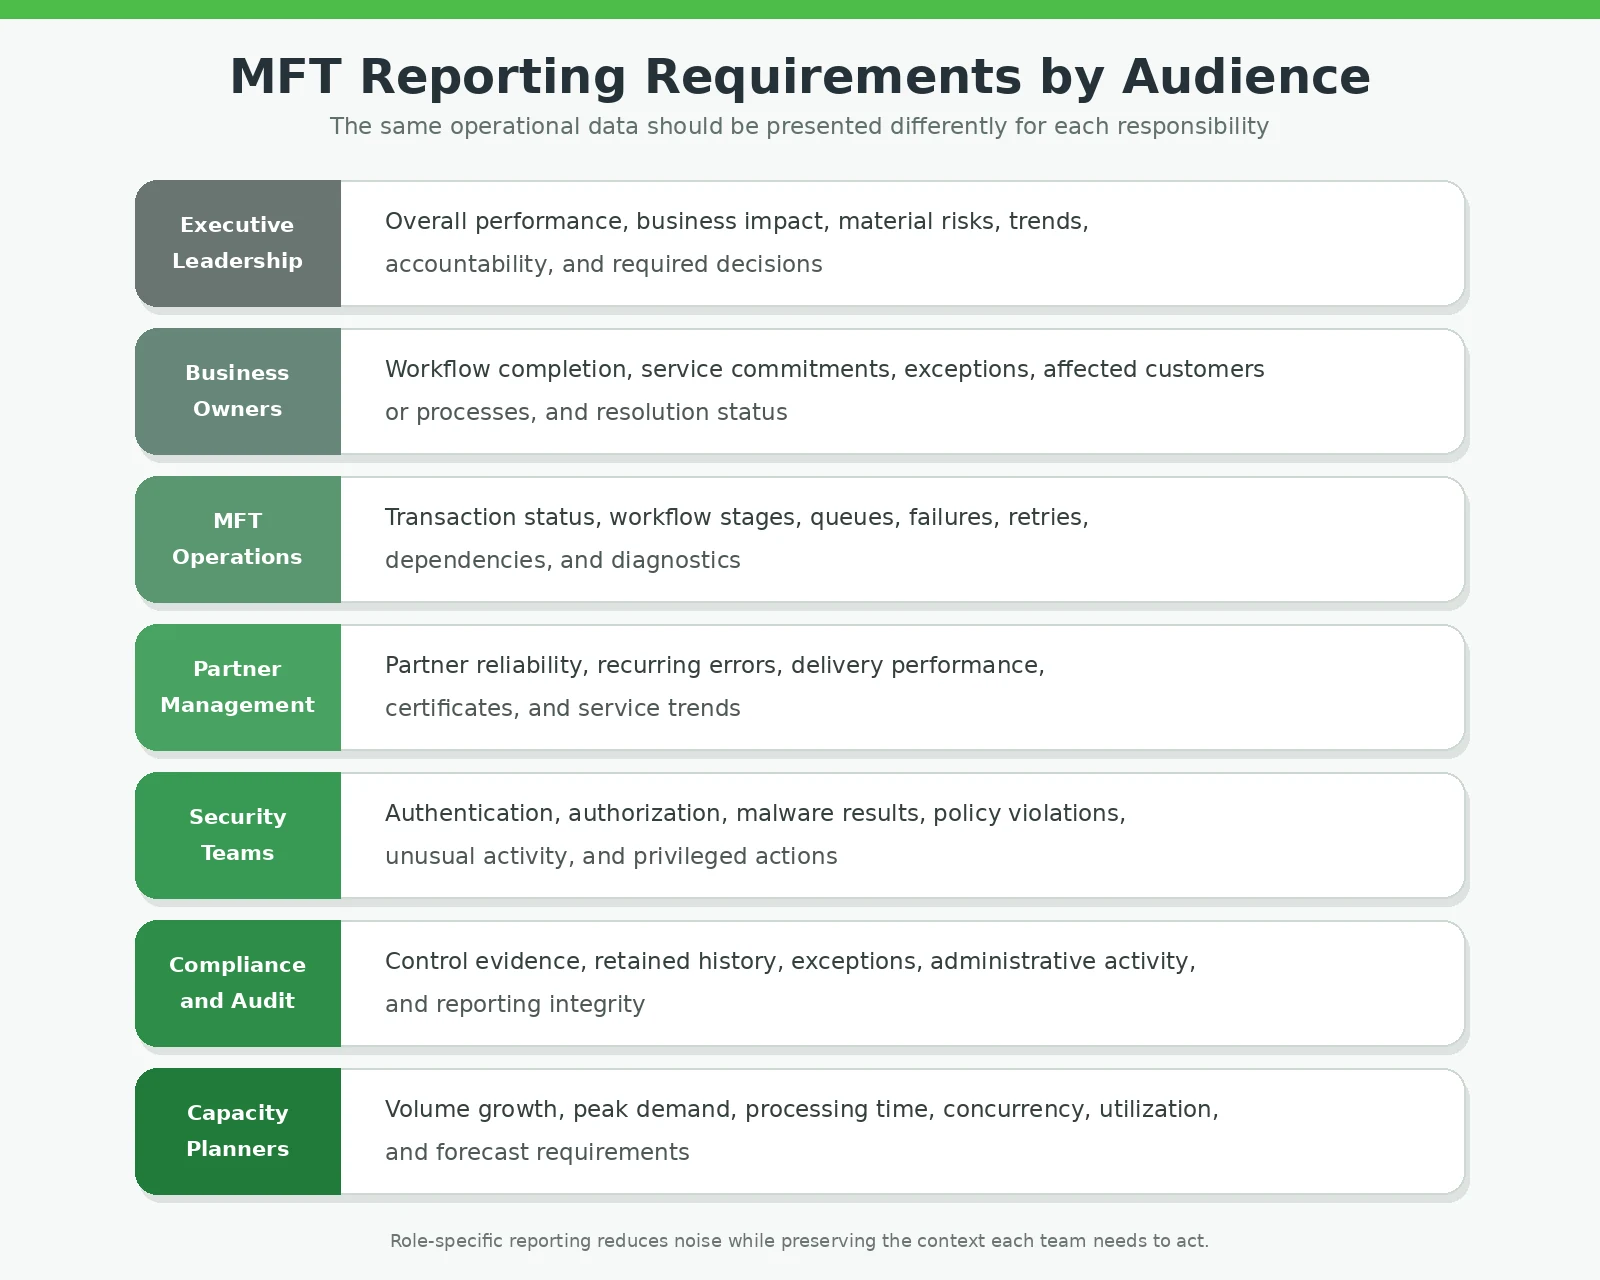
An executive dashboard should emphasize material exceptions, trends, business impact, ownership, and decisions.
An operational dashboard should provide the detailed evidence needed to investigate and resolve problems.
Both views can use the same transaction data without displaying the same information.
What Should Management Track?
The right KPIs depend on the organization, its business processes, and the consequences of an interruption. However, an executive MFT scorecard should generally cover the following areas.
Business-Service Performance
Management should be able to determine whether critical data-dependent services are operating as expected.
Recommended indicators include:
- Critical workflows completed
- On-time completion rate
- Missing or late expected activity
- Workflows completed with exceptions
- Important transactions still in progress
- Affected business services
- Performance trends by business unit or application
The dashboard does not need to reproduce the complete transaction lifecycle. It should show whether the business received the expected outcome and provide authorized drill-down access to supporting evidence.
Service Commitments and Exceptions
Executive reporting should summarize the management implications of service-level performance without recreating the complete operational SLA console.
Useful indicators include:
- Overall SLA or service-level attainment
- Critical workflows currently at risk
- Material breaches
- Recurring causes of missed commitments
- Business units, services, or partners affected
- Accountable service owner
- Current remediation status
Minor technical delays and material business failures should not receive identical treatment. Reporting should reflect business priority and potential impact.
Reliability and Operational Quality
Management needs to know whether service quality is improving or whether teams are repeatedly resolving the same problems.
Useful measures include:
- Success and exception trends
- Retry rates
- Manual reprocessing
- Recurring failure categories
- Open critical exceptions
- Mean time to detect
- Mean time to acknowledge
- Mean time to resolve
- Repeat incidents involving the same workflow or dependency
A good report should make recurring problems visible before workaround becomes an undocumented business process.
Trading-Partner Performance
External partners can directly affect internal service quality.
Management-level partner reporting can summarize:
- On-time activity
- Connection reliability
- Repeated validation or authentication problems
- Missing acknowledgments
- Retry frequency
- Unplanned interruptions
- Unusual changes in transaction patterns
- Partners requiring operational review
Detailed technical partner diagnostics belong in operational views. The executive dashboard should identify patterns, impact, accountability, and required action.
Volume and Capacity Trends
Management should understand whether the platform is prepared for future demand.
Useful indicators include:
- Files processed by reporting period
- Total data volume
- Growth by application, business unit, or partner
- Peak processing demand
- Peak concurrency
- Processing-time trends
- Backlog growth
- Current utilization
- Forecast demand compared with available capacity
Growth is generally welcome. Discovering that growth through production delays is less welcome.
Historical reporting allows organizations to plan capacity using measured demand rather than emergency estimates.
Security and Governance
Management does not need every authentication event on the primary dashboard. It does need visibility into material risk and unresolved exceptions.
Relevant indicators may include:
- Significant authentication or authorization anomalies
- Security-policy violations
- Malware or content-inspection detections
- Quarantined or rejected files
- Unexpected destinations
- Unusual movement of sensitive information
- Material administrative changes
- Certificate or key risks
- Open security exceptions
- Responsible owner and response status
Management reporting should explain the scope and potential impact while preserving access to the underlying evidence for authorized security teams.
Operational Improvement
Reporting should show whether investments in automation, architecture, processes, and people are producing results.
Improvement measures may include:
- Reduction in recurring incidents
- Fewer manual interventions
- Reduced reprocessing
- Faster partner onboarding
- Shorter resolution times
- Higher on-time completion
- Reduced alert volume
- Greater workflow automation
- Improved capacity utilization
- Performance changes following platform improvements
A dashboard should not only show that the environment is busy. It should show whether the organization is becoming more effective.
What Makes an MFT Dashboard Customizable?
Changing colors and moving a chart three inches to the left does not make a dashboard meaningfully customizable.
A customizable MFT dashboard should adapt to the organization’s operating model, responsibilities, and business priorities.
Authorized users should be able to create relevant views based on:
- Role
- Business unit
- Subsidiary
- Tenant
- Application
- Trading partner
- Workflow
- Service tier
- Data classification
- Geography
- Environment
- Transaction status
- Reporting period
Useful customization can also include:
- Selecting the measures displayed
- Applying saved filters
- Defining thresholds
- Selecting comparison periods
- Separating critical and noncritical services
- Creating role-specific views
- Drilling down into supporting transactions
- Scheduling approved reports
- Exporting or sharing authorized results
Customization must not bypass security. A manager should see the information required for that manager’s responsibilities—not every transaction merely because the platform can display it.
Real-Time Dashboards and Scheduled Reports Serve Different Purposes
Real-time dashboards help teams understand current conditions.
Scheduled reports help organizations review trends, demonstrate accountability, support governance meetings, and plan improvements.
Real-Time Dashboards Support
- Current service status
- At-risk workflows
- Active exceptions
- Material backlogs
- Partner interruptions
- Security conditions
- Immediate management decisions
Scheduled Reports Support
- Executive service reviews
- Business-unit performance
- Partner-performance reviews
- Capacity planning
- Risk and compliance committees
- Continuous-improvement programs
- Audit preparation
- Monthly or quarterly governance
A scheduled report is valuable for reviewing performance. It should not be the first notification of a critical failure.
Reporting Must Be Actionable
A dashboard indicator should help the viewer determine:
- What happened?
- Which service or business process is affected?
- How serious is it?
- Who owns the response?
- What action is underway?
- Is the condition improving?
- Does management need to intervene?
A red indicator without context creates another investigation.
An actionable indicator explains the relevant threshold, identifies the affected service, shows accountable ownership, summarizes current response activity, and provides access to supporting evidence.
This is particularly important for management teams that do not operate the MFT platform directly.
How AI-Assisted Dashboards Improve MFT Reporting
Traditional dashboards display metrics, trends, and exceptions. They remain essential, but a user may still need to examine several views or ask an administrator to explain why a measure changed.
AI-assisted dashboards can help transform operational data into management context.
Potential capabilities include:
- Summarizing important changes in plain language
- Identifying unusual volumes, destinations, processing times, or failure patterns
- Comparing current activity with historical behavior
- Correlating performance changes with workflows, partners, infrastructure, or recent configuration changes
- Highlighting critical services moving outside their normal operating range
- Identifying the business processes affected by an exception
- Grouping related events into a single management-level condition
- Generating role-appropriate executive summaries
- Recommending areas for investigation
- Supporting natural-language operational questions
Instead of interpreting several graphs, an authorized user might ask:
- Which critical services are performing below their normal range?
- Which partners produced the most exceptions this month?
- What changed before processing time increased?
- Which applications are creating the greatest growth in volume?
- Which unresolved exceptions present the greatest business risk?
- Did reliability improve after the recent workflow change?
- Which services require additional capacity?
- What should be reviewed in the next partner-governance meeting?
AI can help users reach the relevant evidence faster. It should not be treated as unquestionable evidence itself.
AI Reporting Requires Governance
An AI-generated explanation is only as reliable as the information, context, permissions, and governance supporting it.
AI-assisted reporting should operate within the same controls applied to the MFT platform:
- Zero Trust access
- Least-privilege authorization
- Role-based visibility
- Tenant and business-unit separation
- Protection of sensitive transaction information
- Auditing of prompts, responses, and actions
- Data-retention requirements
- Human review of material conclusions
- Traceability to supporting evidence
The interface should also distinguish among:
- Observed fact: A measured event or condition
- Correlation: Two or more events that occurred in a related context
- Inference: A possible explanation based on available evidence
- Prediction: A forecast of a potential future condition
- Recommendation: A proposed investigative or corrective action
AI should not present a possible cause as though it were a confirmed fact.
A colorful dashboard can show that something is red. AI-assisted observability should help explain why it may be red, what is affected, and where an authorized person should investigate.
Data Quality and Metric Governance Still Matter
Dashboards can look authoritative even when the information underneath them is incomplete or inconsistently defined.
Organizations should establish governance for:
- Metric definitions
- Authoritative data sources
- Business-service ownership
- Workflow ownership
- Transaction correlation
- Success and failure classifications
- Reporting periods and time zones
- Maintenance-window treatment
- Service-level calculations
- Data retention
- Access permissions
- Report approval and distribution
- AI access to reporting data
For example, one department may define success as delivery to an endpoint. Another may require processing and acknowledgment by a downstream application.
Both calculations may be technically correct while describing different outcomes.
AI will not fix inconsistent definitions. It may simply explain the inconsistency faster and with remarkable confidence.
Clear definitions make management information consistent, comparable, explainable, and defensible.
Which File Transfer Platforms Provide Customizable Management Reporting?
Organizations should look for enterprise Managed File Transfer platforms that provide more than fixed transfer logs or basic success-and-failure reports.
Appropriate platforms should offer:
- Configurable and role-specific dashboards
- Business-unit, application, workflow, tenant, and partner views
- Real-time and historical reporting
- Custom filters and reporting periods
- SLA and service-performance visibility
- Trend and capacity reporting
- Security and governance reporting
- Scheduled reports
- Transaction-level drill-down
- Delegated reporting access
- Audited report access
- Analytics, SIEM, ITSM, and observability integration
- AI-assisted summaries or investigation where appropriate
Feature names vary among vendors. Organizations should ask each provider to demonstrate these capabilities using realistic business scenarios rather than accepting a checklist response.
A platform may claim to support customizable reporting when it merely allows users to select columns from a transfer log. That may satisfy a technical reporting requirement, but it does not necessarily provide management intelligence.
Questions to Ask MFT Vendors
When evaluating reporting capabilities, ask vendors:
- Can dashboards be configured separately for executives, business owners, operations, security, and auditors?
- Can reporting be separated by tenant, business unit, application, workflow, and partner?
- Can users define which KPIs appear in each view?
- Can users drill down from a management KPI into its supporting transactions?
- Can the platform report current conditions and historical trends?
- Can reports compare different periods?
- Can the platform identify recurring exception patterns?
- Can reporting show service-level performance without exposing unnecessary technical detail?
- Can reports be scheduled for authorized recipients?
- Can reporting responsibilities be securely delegated?
- Can access to dashboards and reports be audited?
- Can the platform integrate with enterprise analytics, SIEM, ITSM, and observability tools?
- Can AI-generated conclusions link back to supporting evidence?
- Does the platform distinguish factual results from AI-generated inferences?
- Can the vendor demonstrate reporting with the organization’s actual workflows and management requirements?
A polished demonstration containing ideal sample data is useful.
A demonstration showing how the platform handles a late critical workflow, a recurring partner failure, a capacity trend, and a management drill-down is much more useful.
How TDXchange Supports Executive Reporting and AI-Assisted Dashboards
TDXchange provides configurable, role-specific dashboards that can be aligned with business units, workflows, trading partners, tenants, applications, operational responsibilities, and service priorities.
Authorized users can monitor current performance, review historical trends, evaluate exceptions, and investigate the transactions supporting reported results. Granular role-based access and delegated administration help extend appropriate reporting capabilities to business and operational teams while maintaining centralized security and governance.
TDXchange also supports integration with SIEM, analytics, IT service management, and enterprise-observability platforms. This allows MFT performance information to become part of the organization’s broader operational and management view while retaining the transaction context needed for investigation.
AI-assisted operational capabilities are designed to help authorized users:
- Ask natural-language questions
- Summarize operational conditions
- Recognize unusual behavior
- Correlate related events
- Identify affected services
- Locate likely causes
- Find relevant evidence faster
These capabilities operate within TDXchange’s Zero Trust, role-based access, least-privilege, tenant-separation, and auditing controls. AI does not become an alternate route around established governance.
A Practical Executive MFT Scorecard
A concise management scorecard could include:
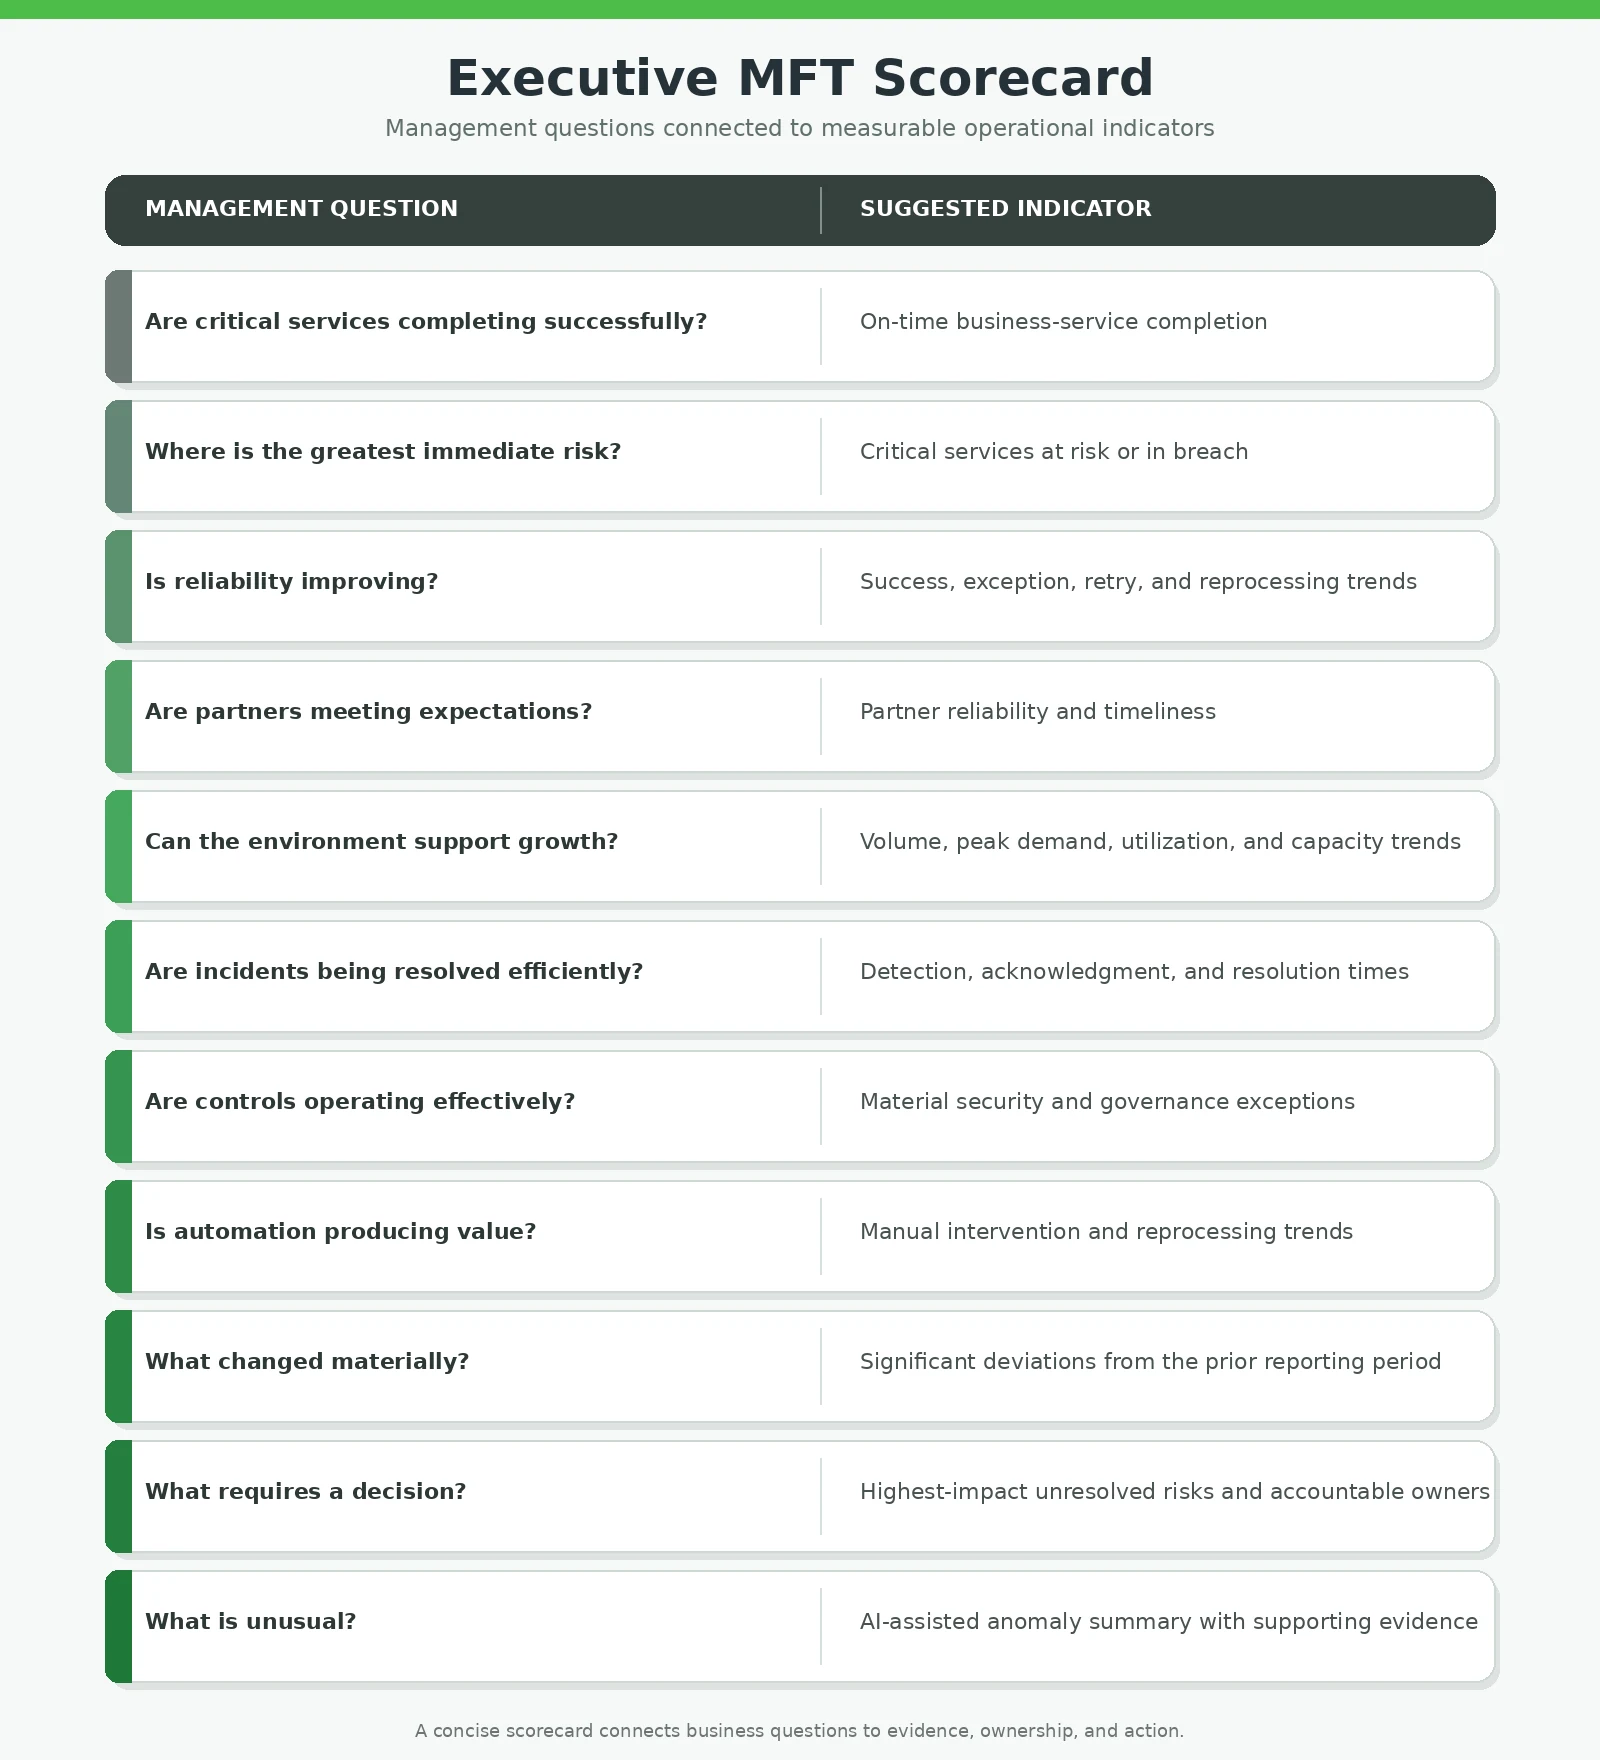
The executive scorecard should remain concise.
The details should be available through controlled drill-down rather than squeezing every transaction, chart, warning, and infrastructure metric into a screen that looks like a cockpit designed by committee.
The Bottom Line
MFT executive reporting should help management determine whether critical data exchanges are reliable, timely, secure, scalable, and aligned with business expectations.
That requires more than fixed reports listing successful and failed transfers.
Effective reporting connects transactions to business services, services to performance expectations, exceptions to accountable owners, and historical activity to future planning. It provides configurable, role-specific dashboards without exposing every user to every detail.
AI-assisted dashboards add value by helping authorized users summarize complex conditions, identify abnormal behavior, correlate related events, ask natural-language questions, and locate relevant evidence faster.
But AI does not replace reporting governance.
Without accurate data, consistent definitions, appropriate access controls, transaction context, and human accountability, an AI-generated executive summary is simply a faster way to reach a questionable conclusion.
The best MFT dashboard is not the one with the most information.
It is the one that helps the right person understand what matters, why it matters, and what should happen next.
About the Author
Hanz Jorgensen is Chief Operating Officer and Managing Member at bTrade, where he oversees daily operations and works closely with the leadership team to shape and execute the company’s strategic direction. With more than 20 years of experience with several different MFT/technology companies spanning system administration, development, customer support, pre-sales, and enterprise solution delivery, Hanz brings a uniquely practical perspective on what organizations actually need from managed file transfer platforms. He leads bTrade’s Solution Consulting team and plays a central role in aligning product capabilities with real customer requirements across regulated and high-complexity environments.
Frequently Asked Questions
What is MFT executive reporting?
MFT executive reporting converts transfer, workflow, partner, security, capacity, and operational activity into management information about service quality, business impact, risk, accountability, and performance trends.
Which file transfer platforms have customizable reporting for management teams?
Enterprise MFT platforms with configurable, role-specific dashboards, historical reporting, service-performance metrics, partner views, scheduled reports, drill-down capabilities, and enterprise analytics integration can support management reporting. TDXchange provides these capabilities together with delegated access and AI-assisted operational intelligence.
What should an MFT executive dashboard show?
An executive dashboard should show critical-service completion, service-level performance, material exceptions, partner reliability, operational trends, capacity risks, significant security conditions, accountable ownership, and issues requiring management action.
What makes an MFT dashboard customizable?
A customizable dashboard allows authorized users to select relevant KPIs, filters, thresholds, reporting periods, and views based on roles, business units, tenants, workflows, applications, partners, service priorities, and other organizational requirements.
What is the difference between an executive dashboard and an operational dashboard?
An executive dashboard summarizes performance, business impact, trends, risk, and accountability. An operational dashboard provides detailed transaction, workflow, infrastructure, and diagnostic information needed to investigate and resolve problems.
How can AI improve MFT dashboards?
AI can summarize operational conditions, identify anomalies, compare current behavior with historical patterns, correlate related events, support natural-language questions, highlight affected services, and recommend areas for investigation.
Can AI determine the root cause of an MFT failure?
AI can help identify likely causes and relevant evidence, but a suggested cause should not automatically be treated as confirmed. Root-cause determination may still require technical investigation and human validation.
What controls should apply to AI-assisted MFT reporting?
AI-assisted reporting should follow Zero Trust, least-privilege, role-based access, tenant separation, data protection, auditing, retention, and human-review requirements. Users should only be able to query information authorized for their roles.
Why are historical MFT reports important?
Historical reporting reveals recurring failures, growth patterns, partner-performance trends, capacity requirements, changes in service quality, and the results of operational improvements.
Should MFT reporting integrate with enterprise analytics platforms?
Yes. Integration with analytics, SIEM, IT service management, compliance, and enterprise-observability platforms can provide a broader organizational view. The MFT platform should retain the transaction and workflow context needed to explain reported conditions.
How does TDXchange support customizable reporting?
TDXchange provides configurable, role-specific dashboards and reporting across business units, tenants, applications, workflows, trading partners, service priorities, transfers, security events, and operational trends. It also supports delegated access, external analytics integration, and AI-assisted operational investigation.
<script type="application/ld+json">
{
  "@context": "https://schema.org",
  "@graph": [
    {
      "@type": "Organization",
      "@id": "https://www.btrade.com/#organization",
      "name": "bTrade",
      "legalName": "bTrade LLC",
      "url": "https://www.btrade.com/",
      "logo": {
        "@type": "ImageObject",
        "@id": "https://www.btrade.com/#logo",
        "url": "https://cdn.prod.website-files.com/66a7f3a6c2fca5ac33297031/695c1145670288594ab07ded_bTrade_logo_w_tagline_variations_36-years.avif",
        "contentUrl": "https://cdn.prod.website-files.com/66a7f3a6c2fca5ac33297031/695c1145670288594ab07ded_bTrade_logo_w_tagline_variations_36-years.avif",
        "width": 1363,
        "height": 327,
        "caption": "bTrade — 36 Years of Innovation"
      },
      "description": "bTrade provides enterprise Managed File Transfer, secure data exchange, cloud MFT, implementation, migration, modernization, and managed MFT services.",
      "address": {
        "@type": "PostalAddress",
        "streetAddress": "10100 N Central Expy, Suite 318",
        "addressLocality": "Dallas",
        "addressRegion": "TX",
        "postalCode": "75231",
        "addressCountry": "US"
      },
      "telephone": "+1-866-446-2935",
      "email": "info@btrade.com",
      "sameAs": [
        "https://www.linkedin.com/company/btrade",
        "https://www.facebook.com/bTrade.SoftwareSolutions",
        "https://www.youtube.com/@bTrade_MFT"
      ]
    },
    {
      "@type": "Person",
      "@id": "https://www.btrade.com/#hanz-jorgensen",
      "name": "Hanz Jorgensen",
      "url": "https://www.linkedin.com/in/hanzjorgensen/",
      "jobTitle": "Chief Operating Officer and Managing Member",
      "worksFor": {
        "@id": "https://www.btrade.com/#organization"
      },
      "description": "Hanz Jorgensen is Chief Operating Officer and Managing Member at bTrade. He has more than 20 years of experience across Managed File Transfer system administration, development, customer support, pre-sales, and enterprise solution delivery."
    },
    {
      "@type": "ImageObject",
      "@id": "https://www.btrade.com/blogs/mft-reporting-ai-dashboards-management#primaryimage",
      "url": "https://cdn.prod.website-files.com/66a7f3a6c2fca5ac33297043/6ac113aef973fcb3fb0e470d_bTrade_MFT_AI_Dashboards_500x333_v2.webp",
      "contentUrl": "https://cdn.prod.website-files.com/66a7f3a6c2fca5ac33297043/6ac113aef973fcb3fb0e470d_bTrade_MFT_AI_Dashboards_500x333_v2.webp",
      "width": 500,
      "height": 333,
      "caption": "MFT executive reporting and AI-assisted dashboards",
      "representativeOfPage": true
    },
    {
      "@type": "BreadcrumbList",
      "@id": "https://www.btrade.com/blogs/mft-reporting-ai-dashboards-management#breadcrumb",
      "itemListElement": [
        {
          "@type": "ListItem",
          "position": 1,
          "name": "Home",
          "item": "https://www.btrade.com/"
        },
        {
          "@type": "ListItem",
          "position": 2,
          "name": "Blogs",
          "item": "https://www.btrade.com/media/blog"
        },
        {
          "@type": "ListItem",
          "position": 3,
          "name": "MFT Executive Reporting and AI-Assisted Dashboards",
          "item": "https://www.btrade.com/blogs/mft-reporting-ai-dashboards-management"
        }
      ]
    },
    {
      "@type": [
        "BlogPosting",
        "TechArticle"
      ],
      "@id": "https://www.btrade.com/blogs/mft-reporting-ai-dashboards-management#article",
      "mainEntityOfPage": {
        "@type": "WebPage",
        "@id": "https://www.btrade.com/blogs/mft-reporting-ai-dashboards-management"
      },
      "url": "https://www.btrade.com/blogs/mft-reporting-ai-dashboards-management",
      "headline": "MFT Executive Reporting and AI-Assisted Dashboards: What Management Teams Should Track",
      "description": "See how customizable MFT reporting, executive dashboards, and AI-assisted observability help management teams track performance, risk, and capacity.",
      "datePublished": "2026-10-03",
      "dateModified": "2026-10-03",
      "inLanguage": "en-US",
      "isAccessibleForFree": true,
      "author": {
        "@id": "https://www.btrade.com/#hanz-jorgensen"
      },
      "publisher": {
        "@id": "https://www.btrade.com/#organization"
      },
      "image": {
        "@id": "https://www.btrade.com/blogs/mft-reporting-ai-dashboards-management#primaryimage"
      },
      "thumbnailUrl": "https://cdn.prod.website-files.com/66a7f3a6c2fca5ac33297043/6ac113aef973fcb3fb0e470d_bTrade_MFT_AI_Dashboards_500x333_v2.webp",
      "articleSection": [
        "Managed File Transfer",
        "Executive Reporting",
        "AI-Assisted Dashboards",
        "MFT Observability",
        "Operational Intelligence"
      ],
      "keywords": [
        "MFT reporting",
        "MFT executive reporting",
        "MFT dashboards",
        "AI-assisted dashboards",
        "customizable MFT reporting",
        "Managed File Transfer reporting",
        "MFT performance monitoring",
        "MFT management dashboards",
        "AI-assisted observability",
        "predictive operational intelligence",
        "MFT capacity planning",
        "trading partner performance",
        "TDXchange"
      ],
      "about": [
        {
          "@type": "Thing",
          "name": "Managed File Transfer",
          "sameAs": "https://en.wikipedia.org/wiki/Managed_file_transfer"
        },
        {
          "@type": "Thing",
          "name": "Executive dashboards"
        },
        {
          "@type": "Thing",
          "name": "AI-assisted observability"
        },
        {
          "@type": "Thing",
          "name": "Operational intelligence"
        }
      ],
      "mentions": [
        {
          "@type": "SoftwareApplication",
          "name": "TDXchange",
          "applicationCategory": "Managed File Transfer",
          "operatingSystem": "Enterprise",
          "url": "https://www.btrade.com/solutions/tdxchange",
          "provider": {
            "@id": "https://www.btrade.com/#organization"
          }
        },
        {
          "@type": "WebPage",
          "name": "What Is MFT Observability? Complete Visibility for Enterprise File Transfer",
          "url": "https://www.btrade.com/blogs/mft-observability"
        },
        {
          "@type": "WebPage",
          "name": "Managed File Transfer SLA: Best Practices for Reliable, Compliant, High-Performance MFT",
          "url": "https://www.btrade.com/blogs/managed-file-transfer-sla-tdxchange"
        }
      ],
      "abstract": "MFT executive reporting translates transfer, workflow, partner, security, capacity, and infrastructure activity into management information about business-service performance, risk, accountability, operational trends, and required decisions. AI-assisted dashboards add context by identifying anomalies, correlating related events, supporting natural-language questions, and directing authorized users to relevant evidence.",
      "isPartOf": {
        "@type": "Blog",
        "@id": "https://www.btrade.com/media/blog#blog",
        "name": "bTrade Managed File Transfer Blog",
        "url": "https://www.btrade.com/media/blog",
        "publisher": {
          "@id": "https://www.btrade.com/#organization"
        }
      },
      "breadcrumb": {
        "@id": "https://www.btrade.com/blogs/mft-reporting-ai-dashboards-management#breadcrumb"
      }
    },
    {
      "@type": "FAQPage",
      "@id": "https://www.btrade.com/blogs/mft-reporting-ai-dashboards-management#faq",
      "url": "https://www.btrade.com/blogs/mft-reporting-ai-dashboards-management#faq",
      "name": "MFT Executive Reporting and AI-Assisted Dashboards FAQs",
      "isPartOf": {
        "@id": "https://www.btrade.com/blogs/mft-reporting-ai-dashboards-management"
      },
      "mainEntity": [
        {
          "@type": "Question",
          "name": "What is MFT executive reporting?",
          "acceptedAnswer": {
            "@type": "Answer",
            "text": "MFT executive reporting converts transfer, workflow, partner, security, capacity, and operational activity into management information about service quality, business impact, risk, accountability, and performance trends."
          }
        },
        {
          "@type": "Question",
          "name": "Which file transfer platforms have customizable reporting for management teams?",
          "acceptedAnswer": {
            "@type": "Answer",
            "text": "Enterprise MFT platforms with configurable, role-specific dashboards, historical reporting, service-performance metrics, partner views, scheduled reports, drill-down capabilities, and enterprise analytics integration can support management reporting. TDXchange provides these capabilities together with delegated access and AI-assisted operational intelligence."
          }
        },
        {
          "@type": "Question",
          "name": "What should an MFT executive dashboard show?",
          "acceptedAnswer": {
            "@type": "Answer",
            "text": "An executive dashboard should show critical-service completion, service-level performance, material exceptions, partner reliability, operational trends, capacity risks, significant security conditions, accountable ownership, and issues requiring management action."
          }
        },
        {
          "@type": "Question",
          "name": "What makes an MFT dashboard customizable?",
          "acceptedAnswer": {
            "@type": "Answer",
            "text": "A customizable dashboard allows authorized users to select relevant KPIs, filters, thresholds, reporting periods, and views based on roles, business units, tenants, workflows, applications, partners, service priorities, and other organizational requirements."
          }
        },
        {
          "@type": "Question",
          "name": "What is the difference between an executive dashboard and an operational dashboard?",
          "acceptedAnswer": {
            "@type": "Answer",
            "text": "An executive dashboard summarizes performance, business impact, trends, risk, and accountability. An operational dashboard provides detailed transaction, workflow, infrastructure, and diagnostic information needed to investigate and resolve problems."
          }
        },
        {
          "@type": "Question",
          "name": "How can AI improve MFT dashboards?",
          "acceptedAnswer": {
            "@type": "Answer",
            "text": "AI can summarize operational conditions, identify anomalies, compare current behavior with historical patterns, correlate related events, support natural-language questions, highlight affected services, and recommend areas for investigation."
          }
        },
        {
          "@type": "Question",
          "name": "Can AI determine the root cause of an MFT failure?",
          "acceptedAnswer": {
            "@type": "Answer",
            "text": "AI can help identify likely causes and relevant evidence, but a suggested cause should not automatically be treated as confirmed. Root-cause determination may still require technical investigation and human validation."
          }
        },
        {
          "@type": "Question",
          "name": "What controls should apply to AI-assisted MFT reporting?",
          "acceptedAnswer": {
            "@type": "Answer",
            "text": "AI-assisted reporting should follow Zero Trust, least-privilege, role-based access, tenant separation, data protection, auditing, retention, and human-review requirements. Users should only be able to query information authorized for their roles."
          }
        },
        {
          "@type": "Question",
          "name": "Why are historical MFT reports important?",
          "acceptedAnswer": {
            "@type": "Answer",
            "text": "Historical reporting reveals recurring failures, growth patterns, partner-performance trends, capacity requirements, changes in service quality, and the results of operational improvements."
          }
        },
        {
          "@type": "Question",
          "name": "Should MFT reporting integrate with enterprise analytics platforms?",
          "acceptedAnswer": {
            "@type": "Answer",
            "text": "Yes. Integration with analytics, SIEM, IT service management, compliance, and enterprise-observability platforms can provide a broader organizational view. The MFT platform should retain the transaction and workflow context needed to explain reported conditions."
          }
        },
        {
          "@type": "Question",
          "name": "How does TDXchange support customizable reporting?",
          "acceptedAnswer": {
            "@type": "Answer",
            "text": "TDXchange provides configurable, role-specific dashboards and reporting across business units, tenants, applications, workflows, trading partners, service priorities, transfers, security events, and operational trends. It also supports delegated access, external analytics integration, and AI-assisted operational investigation."
          }
        }
      ]
    }
  ]
}
</script>