

MFT Observability as the Foundation of Predictive Operational Intelligence
Enterprise observability is no longer just about collecting logs, displaying dashboards, or notifying administrators when something has already gone wrong. As organizations expand their Enterprise Data Exchange ecosystems to include cloud platforms, APIs, AI services, edge computing, and thousands of trading partners, observability becomes the foundation for intelligent operations rather than reactive monitoring.
This vision is described in our companion article, The Future of Enterprise Data Exchange: AI, Zero Trust, Quantum-Safe Security, and the Evolution of Managed File Transfer, where we identify Pillar 5: Enterprise Observability Will Evolve Into Predictive Operational Intelligence as one of the six foundational pillars shaping the next generation of Enterprise Data Exchange.
Today's observability platforms answer questions such as:
- What changed?
- Who made the change?
- When did it happen?
- Which workflow failed?
Tomorrow's platforms will answer much more strategic questions:
- Which business processes are at risk of missing their SLA?
- Which configuration changes are most likely to impact production?
- Which trading partners are beginning to experience abnormal behavior?
- What corrective action should operations teams take before customers are affected?
By combining comprehensive telemetry, workflow visibility, immutable audit trails, AI-assisted analysis, and business context, observability evolves from operational reporting into predictive operational intelligence. Rather than simply detecting failures, Enterprise Data Exchange platforms will increasingly anticipate issues, recommend corrective actions, and help organizations prevent outages before they occur.
At bTrade, we view observability as far more than an operational feature. It is a strategic capability that enables organizations to improve operational resilience, strengthen governance, simplify compliance, and deliver more reliable business outcomes. That is why it serves as one of the six foundational pillars in our Enterprise Data Exchange vision and continues to shape the evolution of TDXchange.
Executive Summary
Managed File Transfer observability is the ability to understand the complete state and behavior of an MFT environment in real time and historically.
It connects transfer activity, workflow execution, identities, configuration changes, security events, infrastructure performance, partner behavior, and business context so organizations can determine:
- What happened
- Where it happened
- When it happened
- Who or what initiated it
- Which systems and partners were involved
- Why a transaction succeeded, slowed, or failed
- What business or security impact resulted
MFT observability goes beyond collecting logs. It correlates technical events into an end-to-end explanation of each transaction and the environment supporting it.
This visibility helps organizations troubleshoot faster, detect abnormal behavior, improve resilience, strengthen governance, support compliance, and move from reactive monitoring toward predictive operational intelligence.
Key Takeaways:
- Observability vs. Logging: Modern MFT requires true observability, not just logs. Teams need to trace what changed, who made changes, how files moved through each stage, and where failures occurred with complete context and timing data.
- Configuration Change Tracking: Many MFT incidents originate from or are influenced by configuration changes, including partner updates, workflow modifications, certificate rotations, permission changes, and infrastructure updates. Immutable audit trails of all system changes with timestamps and user attribution enable teams to correlate issues with specific modifications.
- End-to-End Transfer Visibility: An enterprise file may pass through numerous stages, including reception, authentication, validation, workflow execution, routing, delivery, acknowledgment, and auditing. Observability provides visibility into every stage, timing, retries, and decision points, dramatically reducing troubleshooting time.
- Content-Level Search Capability: Secure, compliant search within file contents answers critical questions (Was invoice X transferred? Did batch contain record Y?) for incident response, regulatory audits, partner disputes, and data loss prevention.
- Change-Aware Alerting: Beyond failure alerts, modern MFT platforms alert on configuration changes themselves. Security-sensitive modifications trigger notifications before degrading into outages, breaches, or compliance violations.
- TDXchange Built-In Observability: TDXchange provides complete change tracking, change-aware alerts, end-to-end transfer traceability, and secure content search as core platform capabilities, not add-ons, supporting MFT as business-critical infrastructure.
What Is MFT Observability?
MFT observability is the ability to understand the internal state, behavior, and business impact of a Managed File Transfer environment by correlating telemetry from across the complete data exchange lifecycle.
A truly observable MFT platform should answer questions such as:
- Did the expected file arrive?
- Which user, application, service account, or partner initiated the transaction?
- Was the initiating identity authenticated and authorized?
- Which policies and workflow steps were applied?
- Where did the file spend time during processing?
- Were validation, transformation, encryption, or inspection steps completed?
- Was the file delivered and acknowledged?
- Did a configuration or infrastructure change influence the outcome?
- Was the activity consistent with normal behavior?
- What business process was affected?
The goal is not merely to collect more data. Most enterprises already have more logs than anyone is eager to read.
The goal is to turn operational data into an accurate, contextual, and actionable explanation.
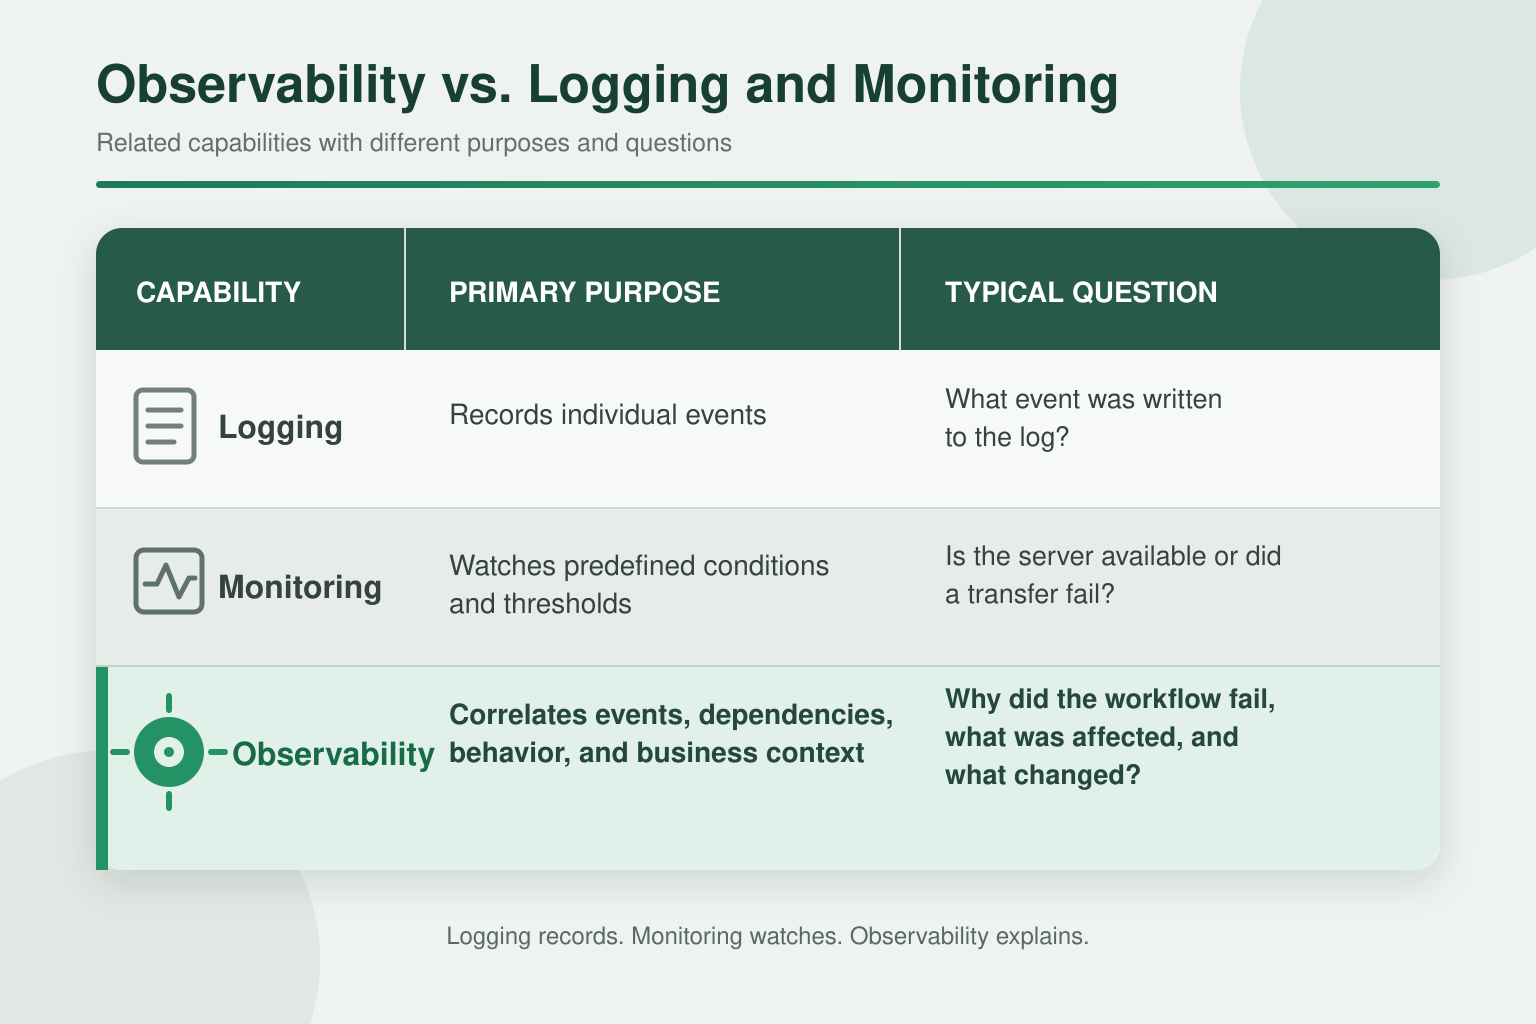
Logging
Logs record events generated by applications, operating systems, security services, workflows, databases, and network components. They are essential evidence, but they are frequently distributed across systems and written in different formats.
A log entry may confirm that a connection failed. It may not explain whether the failure was caused by an expired certificate, a partner configuration change, a firewall update, an unavailable identity provider, or a capacity constraint.
Monitoring
Monitoring evaluates known conditions such as:
- Service availability
- CPU, memory, disk, and network usage
- Queue depth
- Transfer failures
- Missed schedules
- Certificate expiration
- Processing latency
Monitoring is effective when organizations know what condition they need to watch. Its limitation is that predefined checks may not explain unfamiliar problems or reveal relationships across multiple systems.
Observability
Observability correlates logs, metrics, events, traces, changes, identities, workflows, and business context. It enables teams to investigate both anticipated and unanticipated conditions without beginning with a perfectly framed question.
Monitoring may report that a workflow is delayed. Observability should show where the delay began, which dependency is responsible, what recently changed, which files and partners are affected, and whether the pattern is normal.
Why Is MFT Observability Important?
Enterprise file transfer rarely consists of one server sending one file directly to another server.
A modern exchange may involve:
- A source application creates a file.
- An MFT platform receives or retrieves it.
- Identity and authorization controls are applied.
- The file is validated, inspected, transformed, compressed, signed, or encrypted.
- Business rules determine its route and destination.
- The file is delivered through SFTP, FTPS, HTTPS, AS2, AS4, an API, cloud storage, or another service.
- A partner or downstream application processes it.
- An acknowledgment or response is returned.
- The transaction is recorded for operations, security, compliance, and reporting.
A failure anywhere in that chain can interrupt the business process even when the MFT application itself remains available.
Without end-to-end observability, teams may need to manually correlate application logs, transfer records, workflow history, security events, infrastructure monitoring, partner communications, and email threads. That approach becomes slower and less reliable as transaction volumes and integrations grow.
Observability reduces that fragmentation by creating one connected view of the exchange.
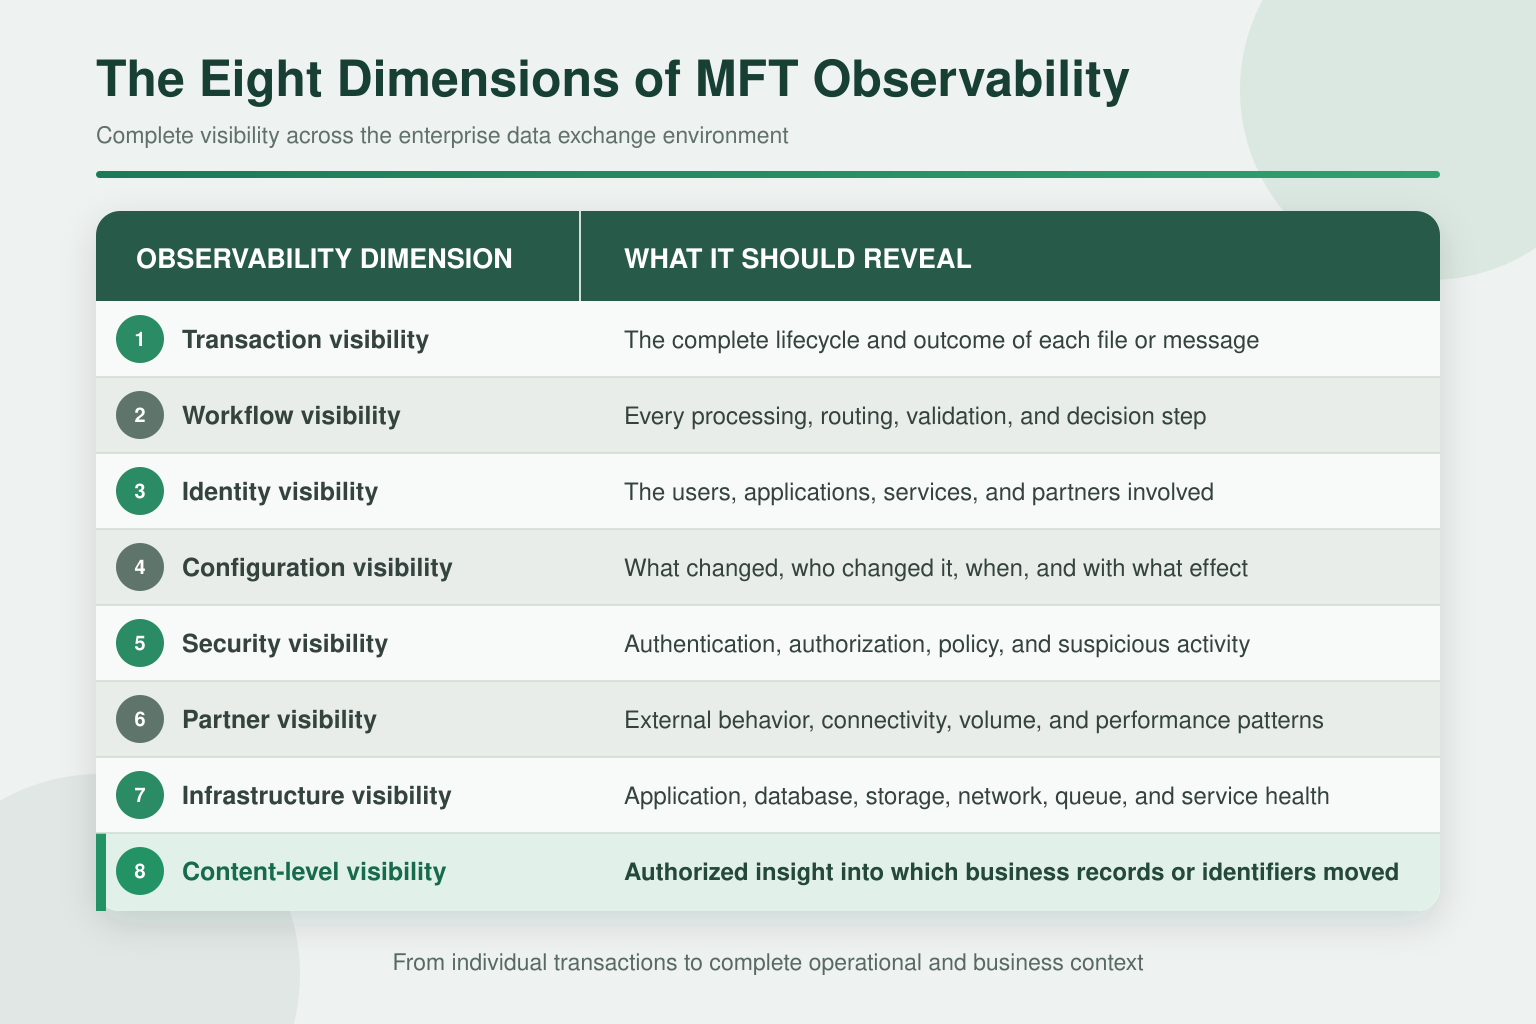
The Eight Dimensions of MFT Observability
1. Transaction Visibility
Transaction visibility should trace a file from its origin through its final destination and, when available, downstream acknowledgment.
Teams should be able to see:
- Source and destination
- Initiating identity
- Trading partner
- Protocol and endpoint
- File name, size, and relevant metadata
- Start and completion times
- Processing duration
- Routing decisions
- Retries and exceptions
- Delivery confirmation
- Acknowledgment status
- Final business outcome
A protocol-level success does not necessarily mean the transaction succeeded. The receiving server may accept the file while the downstream application rejects it. End-to-end visibility must distinguish transport success from business-process completion.
2. Workflow Visibility
Enterprise files commonly pass through multiple workflow steps before delivery.
Observability should show whether each required action completed, including:
- Validation
- Malware or DLP inspection
- Transformation
- Compression or decompression
- Encryption or decryption
- Digital signing
- Approval
- Routing
- Archiving
- Retention
- Notification
- Downstream application processing
When a workflow fails, teams should see the exact step, input, decision, dependency, and error involved instead of searching through several unrelated systems.
3. Identity and Access Visibility
Every transfer and administrative action should be associated with a known identity whenever possible.
This includes:
- Human users
- Administrators
- Applications
- APIs
- Service accounts
- Automated workflows
- Cloud services
- External partners
Identity-aware observability should show authentication results, authorization decisions, assigned roles, permitted destinations, policy evaluations, and privileged activity.
This context supports accountability and Zero Trust because it allows organizations to verify not only that an action occurred, but also who or what performed it and whether it was authorized.
4. Configuration-Change Visibility
Many operational incidents begin with a change.
Examples include:
- A partner endpoint is updated
- A certificate is replaced
- A workflow route is modified
- A firewall rule changes
- A permission is expanded
- A schedule is adjusted
- An identity-provider configuration is updated
- A retention or security policy is altered
The change may have been legitimate and approved. It can still produce an unintended result.
MFT observability should provide an immutable history showing:
- What changed
- The previous and new values
- Who made the change
- When it occurred
- Whether it was approved
- Which transactions or services were subsequently affected
Correlating operational failures with recent changes can dramatically reduce mean time to resolution. It can also reveal unauthorized or suspicious administrative activity before it develops into a larger security incident.
5. Security and Policy Visibility
MFT platforms sit at a sensitive boundary between users, applications, cloud services, and external organizations. Operational visibility must therefore include security context.
Important events include:
- Successful and failed authentication
- Authorization denials
- MFA events
- Certificate and SSH-key activity
- Privileged administrative actions
- Unexpected destination changes
- Policy violations
- Quarantined or rejected files
- Malware or DLP results
- Repeated connection attempts
- Unusual data movement
- Changes to security settings
Security visibility should integrate with SIEM, UEBA, SOAR, and incident-response processes where appropriate. The MFT platform supplies detailed transaction and workflow context that general infrastructure tools may not possess.
6. Trading-Partner Visibility
Enterprise data exchange extends beyond infrastructure controlled by the organization.
Partners can change endpoints, authentication methods, schedules, certificates, protocols, and transfer behavior. They may also experience maintenance events, capacity limitations, or internal processing delays.
Partner-level observability should help teams understand:
- Connection success and failure patterns
- Transfer volumes and file sizes
- Expected versus actual activity
- Authentication and certificate status
- Retry behavior
- Unusual connection frequency
- Endpoint performance
- Maintenance-related interruptions
- Partner-specific errors and trends
This prevents one partner’s activity from disappearing into an environment-wide dashboard and helps operations teams resolve issues with clear evidence rather than a long exchange of “everything looks fine on our side” emails.
7. Infrastructure and Performance Visibility
Business-level observability does not replace infrastructure monitoring. It connects infrastructure behavior to transaction outcomes.
Relevant dependencies may include:
- MFT application nodes
- Secure edge or DMZ services
- Databases
- Storage
- Networks and load balancers
- Identity providers
- Key-management services
- Queues
- Containers and Kubernetes services
- Cloud platforms
- Downstream applications
The important question is not simply whether CPU or storage usage increased. It is whether that change delayed transactions, created backlogs, affected specific partners, or placed a business process at risk.
8. Secure Content-Level Visibility
Traditional transfer logs can show that a file moved without revealing whether it contained a particular business record.
Authorized operations, audit, compliance, or security teams may need to answer questions such as:
- Was a specific invoice transferred?
- Did a batch contain a particular customer record?
- Which file included a requested transaction identifier?
- Did a partner receive a particular document?
- Was restricted information transmitted unexpectedly?
Where business, privacy, and regulatory requirements permit it, controlled content-level search can answer these questions without manually retrieving and reprocessing large numbers of files.
This capability must follow strict safeguards, including:
- Role-based access control
- Least-privilege authorization
- Encryption
- Data minimization
- Auditing of searches and access
- Retention requirements
- Privacy and regulatory policies
Content visibility should never become unrestricted access to sensitive information. Useful visibility without governance is simply a new security problem wearing a dashboard.
What Does End-to-End Transaction Tracing Look Like?
End-to-end tracing connects every relevant event under one transaction or business correlation identifier.
For example, a healthcare record exchange might show:
- The source application created the expected file.
- TDXchange retrieved it using an authorized service account.
- The file passed name, size, structure, and checksum validation.
- Required inspection completed successfully.
- The workflow encrypted and routed the file.
- The destination accepted the transfer.
- The receiving application processed the file.
- An acknowledgment was returned.
- The complete exchange finished within the expected business window.
If processing stops at step seven, a basic transfer log may still report success because delivery occurred. End-to-end tracing shows that the business transaction remains incomplete and identifies the affected application and workflow stage.
How Does Change-Aware Alerting Improve MFT Operations?
Traditional alerts focus primarily on negative outcomes:
- A transfer failed
- A queue exceeded a threshold
- A service became unavailable
- A scheduled job did not run
Those alerts are valuable, but they frequently arrive after the environment has already been affected.
Change-aware alerting notifies appropriate teams when sensitive or operationally significant changes occur, including:
- Partner configuration updates
- Certificate replacement
- Access-control changes
- Workflow modifications
- Security-policy changes
- Destination changes
- Schedule changes
- Retention-policy updates
The objective is not to alert on every administrative click. That would merely replace missing visibility with an impressive quantity of noise.
Alerts should reflect risk, criticality, business context, and the potential scope of impact. High-risk changes may require immediate notification or approval, while lower-risk changes may be recorded for review and correlation.
How Do Behavioral Analytics and Anomaly Detection Support Observability?
Static rules are effective for known conditions. Behavioral analytics can help identify activity that differs meaningfully from an established pattern.
Examples include:
- Transfers occurring at unusual times
- Unexpected destinations
- Abnormal file sizes
- Files arriving significantly smaller than their historical pattern
- Sudden increases or decreases in transaction volume
- Repeated authentication failures
- Unusual partner download activity
- New workflow behavior
- Unexpected administrative changes
- A critical file arriving later than normal
- A workflow producing an unusual number of transactions
An anomaly is a signal, not a verdict. A large transfer may represent legitimate month-end processing rather than data exfiltration. Observability supplies the context needed to evaluate the event accurately.
AI-assisted analysis can help correlate signals, summarize likely causes, identify affected transactions, and recommend investigation steps. These capabilities should operate within the same identity, Zero Trust, role-based access, data-protection, and audit requirements applied to every other enterprise workload.
Real-World MFT Observability Scenarios
Missing File Investigation
A business user reports that a partner did not receive a critical file.
Without centralized observability, operations may need to search multiple logs and contact several teams. With end-to-end tracing, they can immediately determine whether the file was generated, received, processed, routed, delivered, acknowledged, retried, or rejected.
Configuration-Related Failure
A workflow begins failing shortly after a certificate or endpoint change.
Change correlation identifies what was modified, who made the change, which transactions were affected, and whether returning to the previous configuration resolves the problem.
Suspicious Transfer Activity
A privileged account begins sending unusually large files to an unexpected destination.
Identity, authorization, destination, volume, and historical-behavior context allow security teams to investigate quickly and determine whether the activity is legitimate or potentially malicious.
Partner Performance Degradation
A partner’s response times gradually increase while individual transfers continue succeeding.
Trend analysis identifies the developing pattern before it becomes a widespread backlog or business interruption.
Compliance Investigation
An auditor requests evidence showing who accessed, processed, delivered, or changed a sensitive workflow.
Centralized transaction and configuration histories provide a defensible timeline without requiring teams to reconstruct events manually from disconnected systems.
How Does MFT Observability Support Compliance and Governance?
Observability does not automatically create compliance. It provides the evidence and operational context needed to demonstrate that controls were applied and operating as intended.
An observable MFT environment can help document:
- Authentication and authorization decisions
- User and administrative activity
- File-transfer history
- Source and destination information
- Workflow execution
- Security-policy enforcement
- Configuration changes
- File validation and inspection results
- Exceptions, retries, and failures
- Delivery and acknowledgment
- Retention and deletion activity
- Incident investigation and remediation
These capabilities may support requirements associated with HIPAA, PCI DSS, SOX, GDPR, GLBA, DORA, CJIS, NIST frameworks, and other industry or jurisdictional obligations. The applicable controls depend on the information being exchanged, the organization’s role, its operating model, and the way the platform is configured.
The important distinction is that observability makes controls visible and testable. A checkbox can confirm that a feature was enabled. Evidence demonstrates what the control actually did.
How Is MFT Observability Different from SLA Governance?
Observability and SLA governance are related, but they should not be treated as the same discipline.
Observability explains the complete state and behavior of the MFT environment. SLA governance uses that visibility to determine whether defined business commitments are being met.
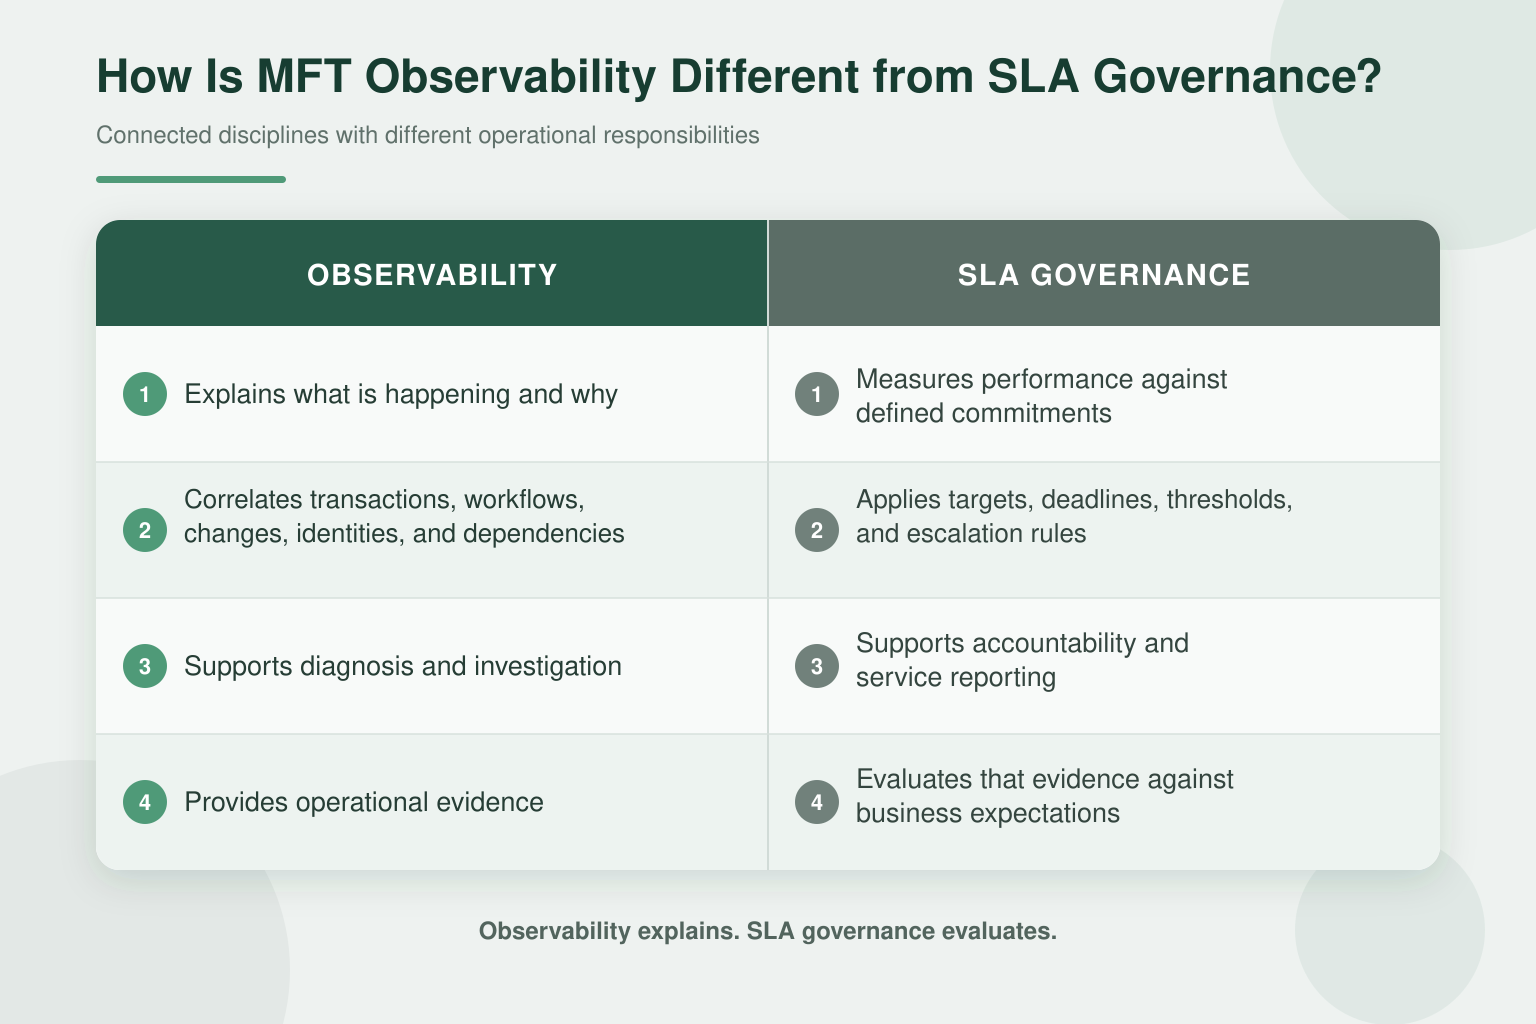
This article intentionally focuses on observability. For guidance on delivery windows, workflow-level targets, performance metrics, proactive breach alerts, escalation, and reporting, read Managed File Transfer SLA: Best Practices for Reliable, Compliant, High-Performance MFT.
How TDXchange Delivers True MFT Observability
TDXchange was designed with the understanding that Managed File Transfer becomes unmanageable at scale without deep visibility. Observability is not an add-on, it’s built into the platform’s architecture.
TDXchange provides:
Complete Change Tracking and Auditing
Every configuration change, whether it’s a workflow update, partner modification, security setting, or retention policy is fully tracked with:
- Who made the change
- When it occurred
- What was changed
- Historical context for audit and troubleshooting
This allows teams to immediately correlate operational or security issues with system changes.
Change-Aware Alerting
TDXchange supports alerting not just on failures, but on meaningful changes to the environment. Security-sensitive and operationally critical updates can trigger notifications, enabling proactive response before issues surface in production.
End-to-End Transfer Traceability
Each file processed by TDXchange carries a complete execution trail. Teams can drill into:
- Every stage of processing
- Timing and latency at each step
- Retries, routing decisions, and transformations
- Final delivery and audit outcomes
This eliminates guesswork and dramatically shortens incident resolution times.
Extending Visibility to Customers and Trading Partners
Enterprise observability should not stop with the internal MFT operations team.
Customers, business units, and external trading partners frequently need visibility into the transfers and workflows that directly affect them. Without controlled self-service access, they must contact the MFT support team whenever they need to determine whether a file was received, processed, delivered, delayed, or rejected.
TDXchange can provide authorized users and trading partners with secure, role-based visibility into their own transfer activity.
Depending on their assigned permissions and the organization’s configuration, authorized users can obtain visibility into:
- Transfer status and history
- Files sent and received
- Delivery results
- Processing outcomes
- Failed or rejected transactions
- Relevant timestamps
- Partner-specific activity
- Notifications and exceptions
- Available transaction and audit information
This visibility is governed through role-based access control, delegated administration, and organizational or trading-partner isolation. External users see only the information and capabilities they are authorized to access. They do not receive unrestricted visibility into the broader enterprise environment.
Providing customers and partners with controlled self-service visibility can reduce support requests, accelerate issue resolution, improve accountability, and strengthen trust. Instead of asking the MFT team whether a file arrived, authorized users can obtain the answer directly.
Internal operations teams still retain the broader cross-system view required for administration, investigation, governance, and security. The difference is that appropriate visibility can now be extended securely to everyone involved in the exchange.
Centralized Monitoring and Dashboards
Centralized dashboards provide visibility into transaction activity, workflow execution, failures, retries, system behavior, and operational trends across distributed enterprise environments.
Identity, Security, and Audit Context
Authentication, authorization, user activity, partner activity, workflow decisions, and administrative changes can be retained as part of the audit history and integrated with enterprise security and observability platforms.
Secure Content-Level Search
Where authorized and appropriately governed, TDXchange can provide controlled visibility into transferred content to help answer business, operational, audit, and security questions while respecting access and data-protection requirements.
Enterprise Integration
TDXchange can share relevant telemetry with SIEM, analytics, IT service management, and enterprise-observability platforms. This allows MFT transaction context to become part of the organization’s broader operational and security view.
AI-Assisted Anomaly Detection and Operational Intelligence
Traditional monitoring depends primarily on predefined rules and thresholds. These controls are effective when an organization already knows the condition it needs to detect, such as a failed transfer, an unavailable service, an expired certificate, or a queue exceeding a defined limit.
Not every operational risk follows a predefined rule.
TDXchange’s anomaly-detection capabilities are designed to analyze historical and current operational patterns to identify activity that differs meaningfully from expected behavior.
Examples may include:
- A critical file arriving later than its historical pattern
- A file arriving significantly smaller or larger than normal
- An unexpected increase or decrease in transaction volume
- Transfers occurring at unusual times
- Communication with an unexpected destination
- Repeated authentication or connection failures
- A trading partner generating an abnormal number of sessions
- A workflow producing an unusual number of files
- Unexpected administrative or configuration activity
- Transfer behavior that differs from an established partner baseline
The purpose of anomaly detection is not to label every unusual event as a security incident or operational failure. An anomaly is a signal that requires context.
TDXchange can combine transaction history, workflow behavior, configuration activity, partner patterns, timing, volume, and operational telemetry to help teams understand why an event is unusual and what may be affected.
AI-assisted operational intelligence can then help:
- Correlate related events
- Identify affected transactions and partners
- Summarize the operational condition
- Highlight likely contributing factors
- Prioritize events according to potential impact
- Recommend appropriate investigation steps
- Help operations teams identify developing issues earlier
These capabilities support the transition from reactive monitoring to predictive operational intelligence. Instead of waiting for a transfer to fail or a user to report a missing file, teams can investigate changes in behavior before they develop into larger disruptions.
AI-assisted observability must follow the same Zero Trust principles as every other TDXchange capability. Access to operational information, transaction metadata, and recommended actions should be controlled through identity, role-based access, least privilege, data protection, and complete auditing.
The objective is not to replace experienced operators. It is to give them earlier signals, better context, and a faster path to the right conclusion.
MFT Observability as Pillar 5 of Enterprise Data Exchange
Enterprise data exchange now spans files, APIs, cloud platforms, applications, AI services, edge systems, and thousands of internal and external identities.
Managing that environment requires more than reactive dashboards.
Pillar 5 of bTrade’s Enterprise Data Exchange vision, Enterprise Observability and Predictive Operational Intelligence, represents the evolution from recording failures to understanding and anticipating operational behavior.
The progression looks like this:
- Logging: Record individual events.
- Monitoring: Detect known failures and threshold violations.
- Observability: Correlate events and explain end-to-end behavior.
- Operational intelligence: Identify patterns, risks, dependencies, and likely causes.
- Predictive operations: Anticipate impact and recommend corrective action before disruption occurs.
Observability is the foundation of that progression. AI cannot provide reliable operational intelligence when the underlying transactions, workflows, identities, changes, and dependencies are fragmented or incomplete.
To explore how observability works together with Zero Trust, AI-assisted operations, crypto agility, scalability, intelligent workflows, and customer-driven innovation, read The Future of Enterprise Data Exchange.
Operational MFT Observability Checklist
Organizations evaluating their current visibility should ask:
- Can we trace every critical file from its source through its final business outcome?
- Can we distinguish transfer success from downstream processing success?
- Can we identify the user, application, service account, or partner behind every action?
- Can we see each validation, inspection, transformation, routing, and delivery step?
- Can we correlate failures with configuration and infrastructure changes?
- Can we identify what changed, who changed it, and when?
- Can we detect unusual partner, user, administrator, or workflow behavior?
- Can we connect infrastructure performance to affected business transactions?
- Can authorized teams locate business records within transferred content when required?
- Can we provide auditors with a complete and defensible transaction history?
- Can we send relevant MFT context to our SIEM and enterprise-observability platforms?
- Can alerts prioritize business impact and risk instead of producing undifferentiated noise?
- Can AI-assisted tools access only the information and actions permitted by the user’s role?
- Can we measure whether observability is reducing detection and resolution time?
If answering these questions requires several teams, multiple tools, and a very long email thread, the environment may have monitoring, but it does not yet have complete observability.
Executive Takeaways
Managed File Transfer observability is not simply a larger collection of logs or a more colorful dashboard.
It is the ability to understand every important exchange across transactions, workflows, identities, configurations, security controls, trading partners, infrastructure, and business outcomes.
That understanding enables organizations to:
- Detect issues earlier
- Troubleshoot faster
- Explain failures accurately
- Identify abnormal behavior
- Strengthen security and governance
- Produce defensible audit evidence
- Improve partner and customer trust
- Build the foundation for predictive operational intelligence
As MFT becomes part of a broader Enterprise Data Exchange architecture, observability becomes essential to keeping critical information movement visible, explainable, resilient, and accountable.
To discuss improving visibility across your Managed File Transfer environment, contact the bTrade team.
About the Author
Andrei Olin is Chief Technology Officer at bTrade, where he leads product strategy, delivery, architecture, and security across the company’s B2B, Managed File Transfer, and secure data exchange platforms.
Andrei has more than 30 years of experience spanning enterprise architecture, software development, infrastructure, cybersecurity, middleware, trading systems, SaaS, and Managed File Transfer. His career includes building mission-critical systems and infrastructure at Bear Stearns and Morgan Stanley, designing and operating enterprise MFT and messaging platforms for Merrill Lynch and Deutsche Bank, and building and scaling SaaS and security products at startups. He holds master’s and bachelor’s degrees in Information Technology with a focus on Information Security.
Frequently Asked Questions:
What is MFT observability?
MFT observability is the ability to understand the complete state, behavior, and business impact of a Managed File Transfer environment by correlating transfer activity, workflows, identities, configuration changes, security events, partner behavior, and infrastructure performance.
Why is MFT observability important?
MFT observability helps organizations detect failures earlier, accelerate troubleshooting, identify abnormal behavior, improve operational resilience, support compliance, and understand whether complete business processes succeeded.
How is MFT observability different from logging?
Logging records individual events. Observability correlates those events with metrics, traces, identities, changes, dependencies, and business context to explain what happened and why.
How is observability different from monitoring?
Monitoring watches predefined conditions, such as service availability or transfer failure. Observability provides the context needed to investigate both expected and unexpected behavior across the complete environment.
What should an MFT observability platform monitor?
It should provide visibility into transactions, workflow steps, users, applications, service accounts, trading partners, configuration changes, security events, infrastructure dependencies, performance, retries, delivery, acknowledgment, and business outcomes.
Is a successful file transfer the same as a successful business transaction?
No. A file may reach its destination while validation, downstream processing, acknowledgment, or another required business step fails. End-to-end observability must show the complete outcome.
How does observability improve MFT security?
Observability provides context around authentication, authorization, privileged activity, configuration changes, destinations, transfer patterns, policy violations, and abnormal behavior. This helps security teams investigate suspicious activity and support Zero Trust governance.
What is change-aware alerting?
Change-aware alerting notifies appropriate teams when important configurations, permissions, certificates, endpoints, workflows, schedules, or security policies change. This can help identify risk before a change causes an outage or security incident.
Can MFT observability support compliance?
Yes. It can provide evidence of file movement, identity and access decisions, workflow execution, security-policy enforcement, configuration changes, delivery, exceptions, and administrative activity. Compliance still depends on proper architecture, configuration, procedures, and governance.
What is the difference between MFT observability and SLA monitoring?
Observability explains what is happening and why. SLA monitoring evaluates that operational evidence against defined delivery, performance, and business commitments.
How does AI improve MFT observability?
AI can help correlate events, identify anomalies, summarize operational conditions, suggest likely causes, and recommend investigation steps. It should operate within Zero Trust, least-privilege, role-based access, and auditing controls.
How does TDXchange support MFT observability?
TDXchange provides end-to-end transaction traceability, workflow visibility, configuration and administrative change tracking, centralized monitoring, policy-driven alerting, security and audit context, enterprise integration, secure content-level visibility where authorized, and AI-assisted operational intelligence.
Can I search file contents securely in TDXchange?
Yes. TDXchange enables controlled, compliant content search with encryption and role-based access controls, without external reprocessing.
What causes most MFT incidents?
Many MFT incidents originate from configuration changes such as workflow updates, certificate rotations, partner modifications, or permission changes.